About

Welcome!
My name is Victor Olaogun, and I turn raw data into real business value.
I’m a passionate, detail-oriented Data Analyst who thrives on uncovering the stories hidden in numbers. With hands-on expertise in Power BI, SQL, Python, and Excel, I specialize in transforming messy datasets into meaningful insights that drive growth, boost efficiency, and spark innovation.
Across industries such as tech, healthcare, and agriculture, I’ve helped teams transition from guesswork to strategy with data that speaks clearly and acts boldly.
What sets me apart? My unique ability to blend analytical thinking with business intuition, turning dashboards into direction and reports into results. I don’t just analyze data; I craft compelling narratives that inspire action.
Whether you’re a recruiter seeking a data-driven professional or a business looking to unlock clarity in chaos, I’m here to bring your data to life.
Beyond data, I love solving problems, meeting new people, playing musical instruments, and writing.
HR Dashboard
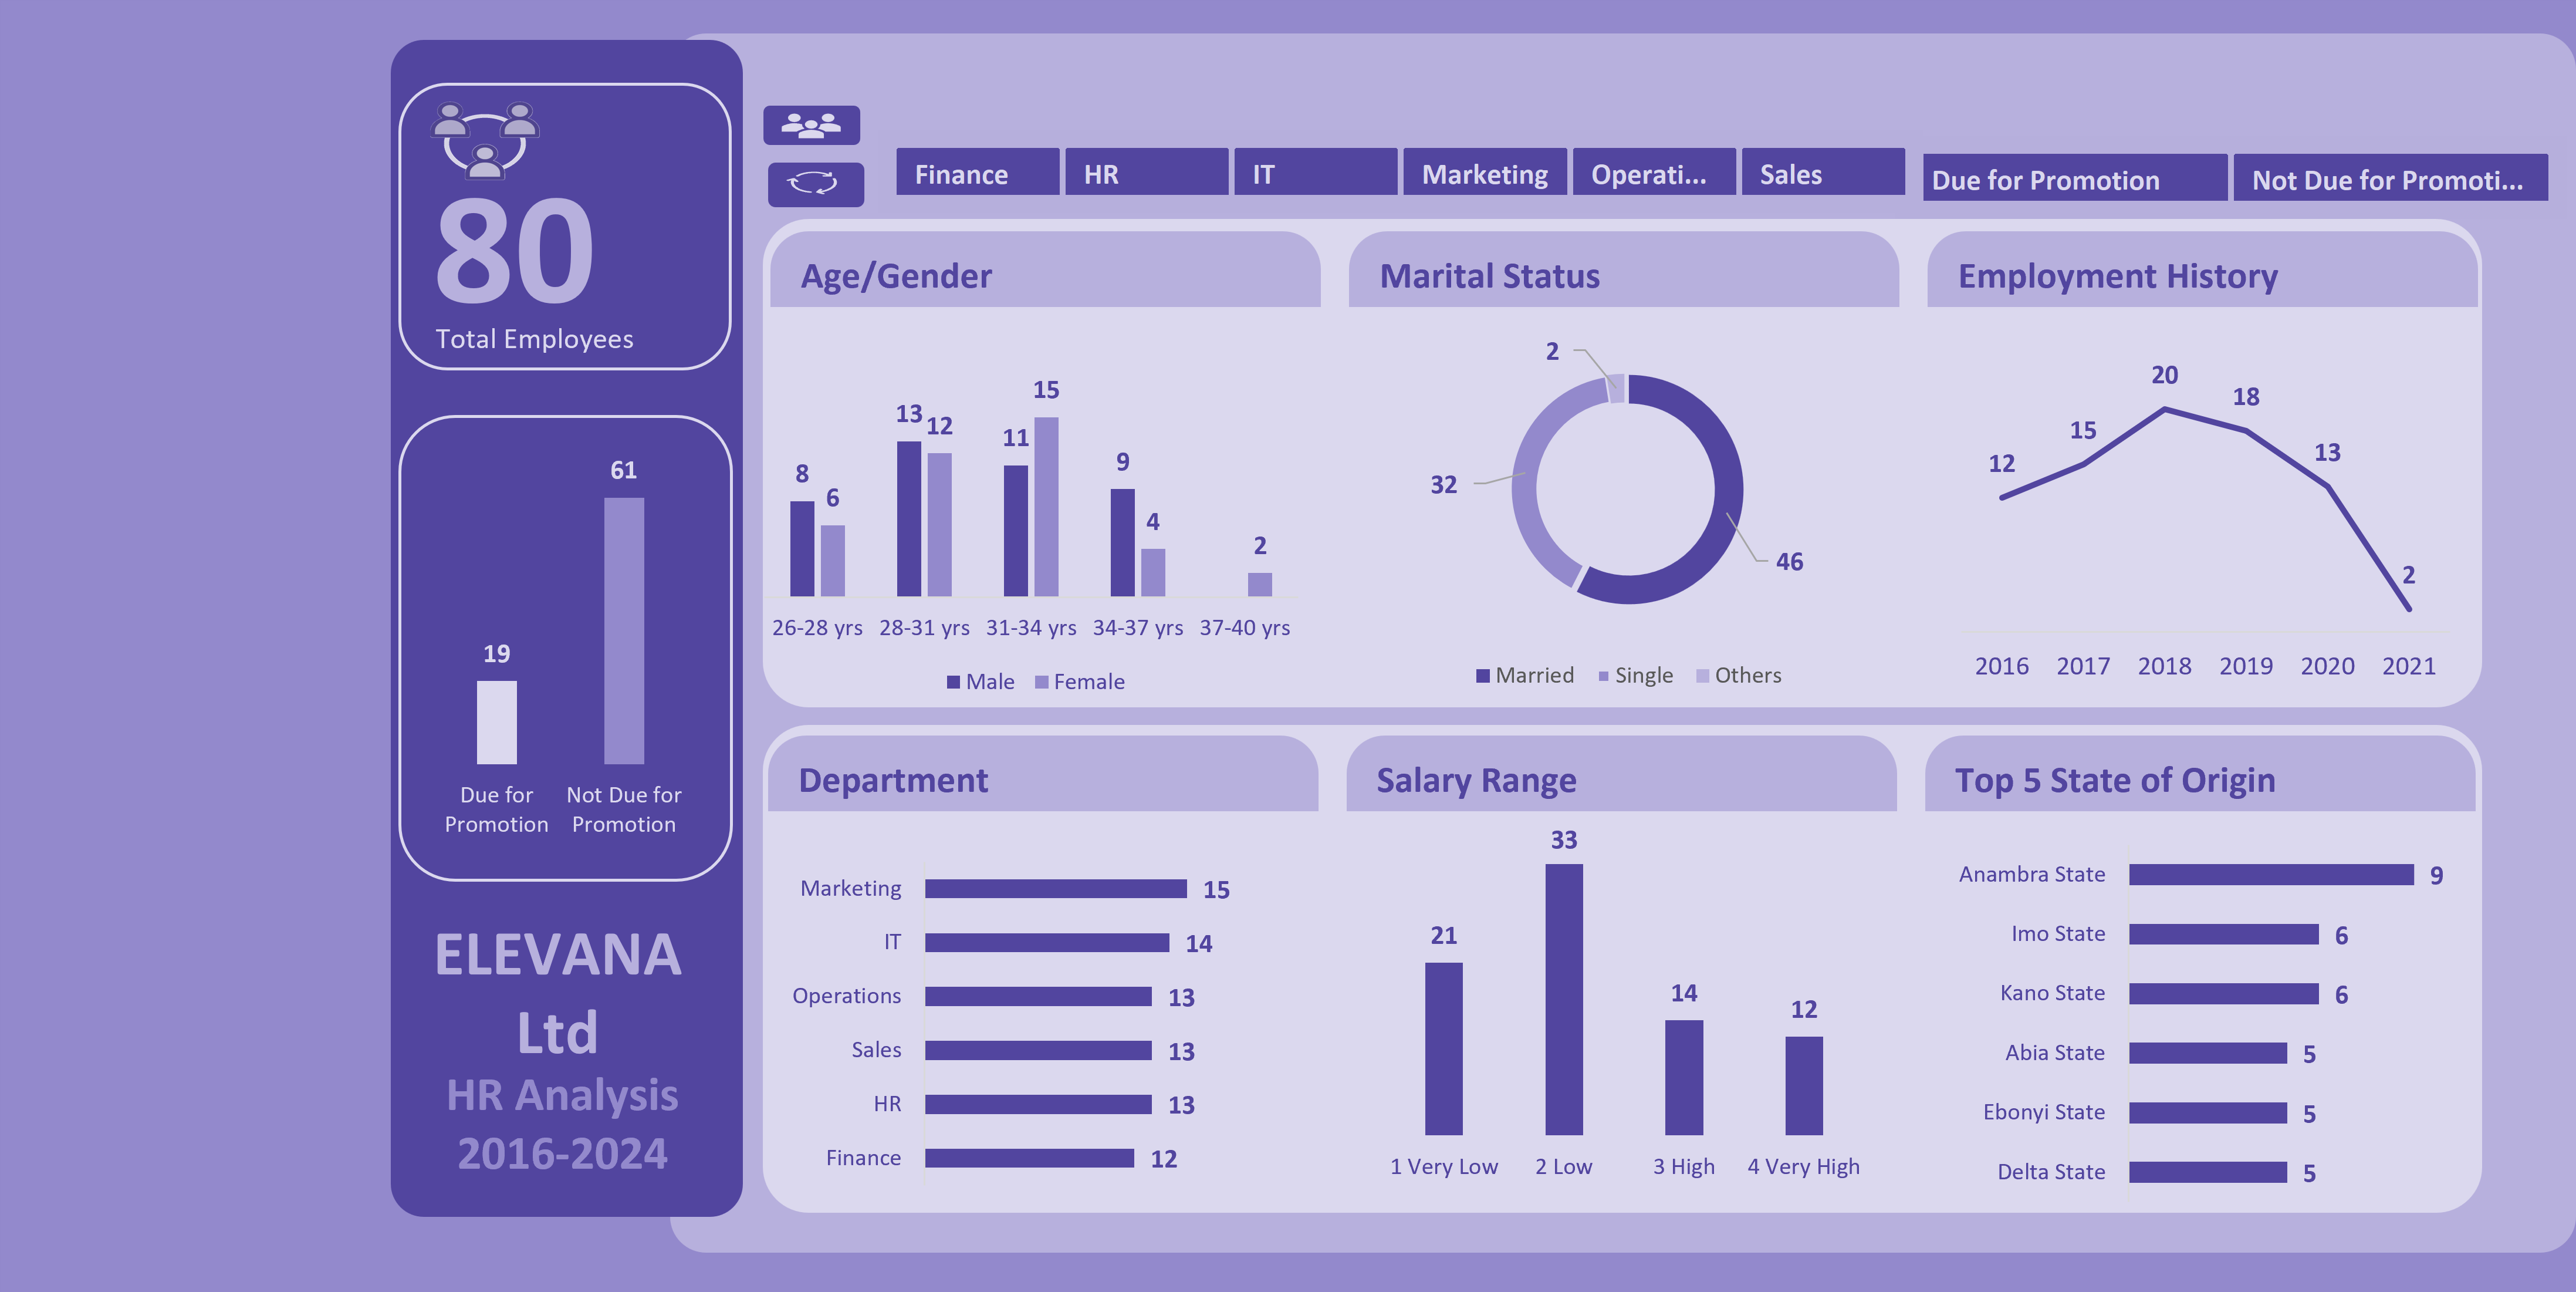
This HR analysis dashboard uncovers hidden talent and drive smart decisions.
What if you could identify promotion-ready employees, spot hiring trends, and evaluate compensation patterns all in one place?
This HR Analysis Dashboard turns raw workforce data into a powerful visual tool that helps organizations make fair, forward-thinking decisions. It covers everything from staffing and salary bands to employee demographics and departmental planning, based on data from 2016 to 2024.
Designed in Excel for clarity and ease, it’s perfect for HR teams who want results, not complications.
Want to see how it all comes together? Click the dashboard to explore the full project.
Global Life Expectancy
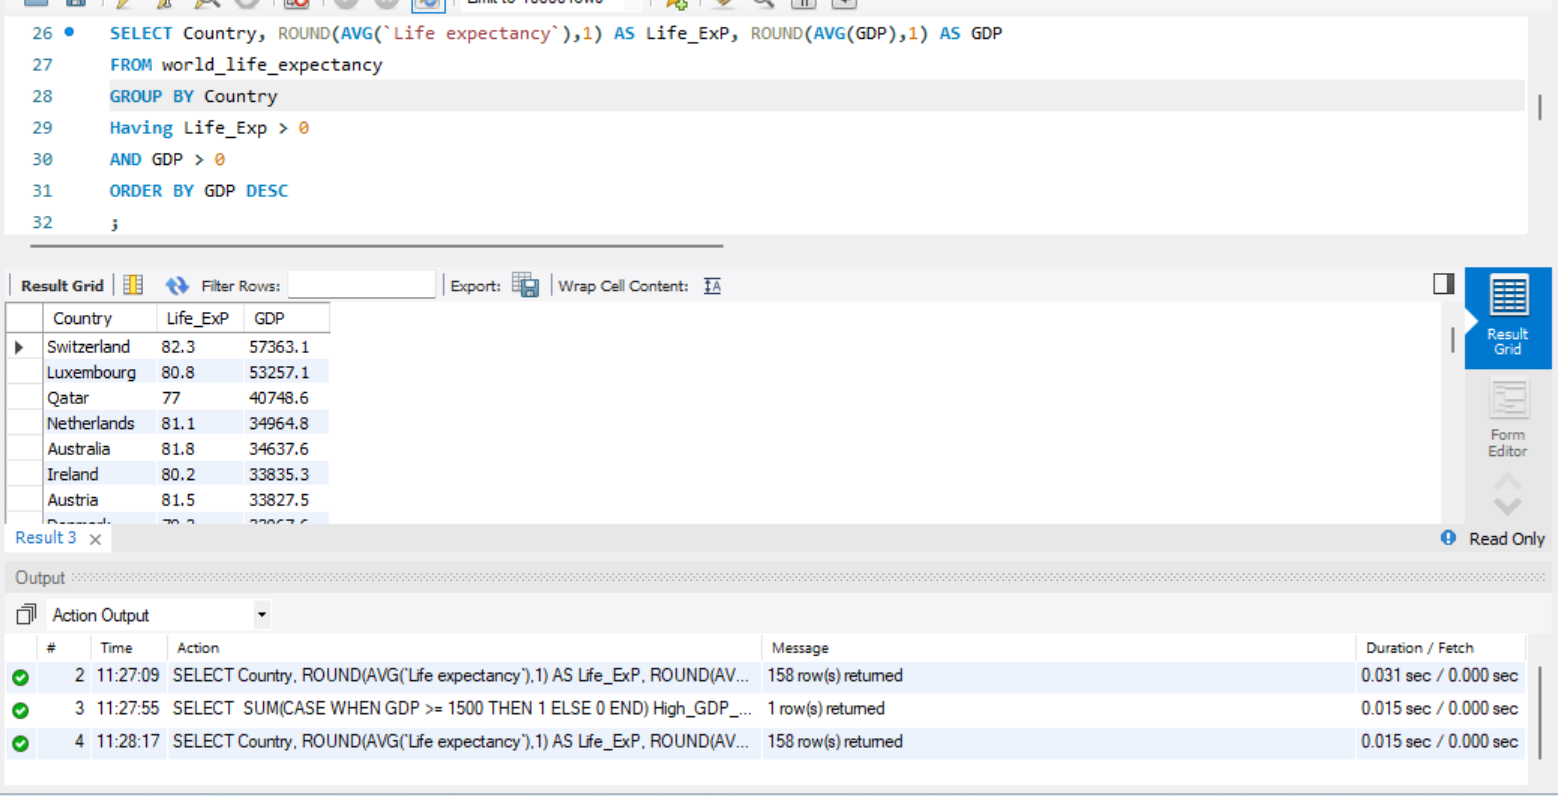
What actually moves the needle on how long people live: money, weight, or a country's development status?
I cleaned a messy global life expectancy dataset spanning over a decade, removing duplicate records, and rebuilding missing values using self-joins and window functions rather than dropping the rows outright. From there, I ran an exploratory analysis in SQL to compare life expectancy against GDP, BMI, adult mortality, and development status across countries.
The result surfaced clear patterns: higher-GDP countries carry a noticeably higher average life expectancy, developed nations outpace developing ones, and mortality trends tell their own story when tracked as a rolling total over time.
This project shows my SQL fundamentals end to end: from raw, duplicate-riddled data to a clean table ready for analysis, using self-joins, ROW_NUMBER, and CASE-based aggregation along the way.
Click the image to explore the full set of cleaning and EDA queries.
e-commerce Dashboard
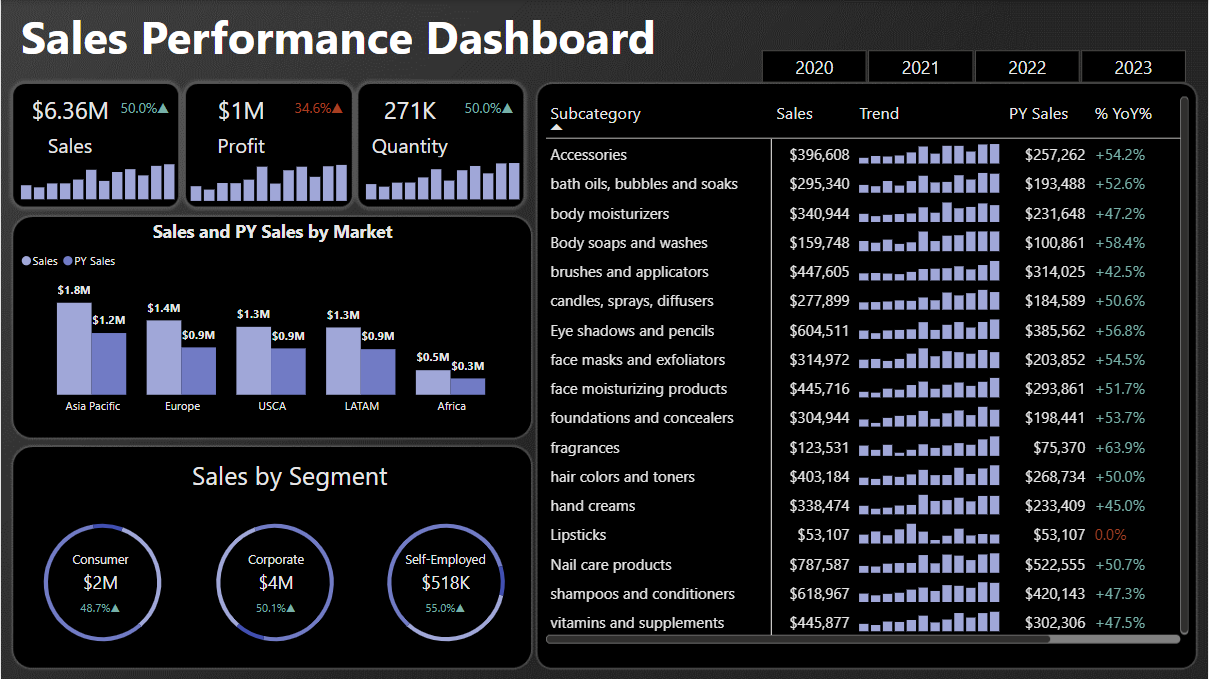
I analyzed $6.36M in Sales in this e-commerce store. Here’s What the Numbers Didn’t Say
While sales soared by 50%, profit took a surprising hit. In this Power BI dashboard, I broke down regional trends, top-performing products, and customer behavior to identify the reasons behind them.
This project demonstrates how I transform raw data into actionable business decisions.
.
Click the dashboard to see the full breakdown.
Casino Sales Dashboard
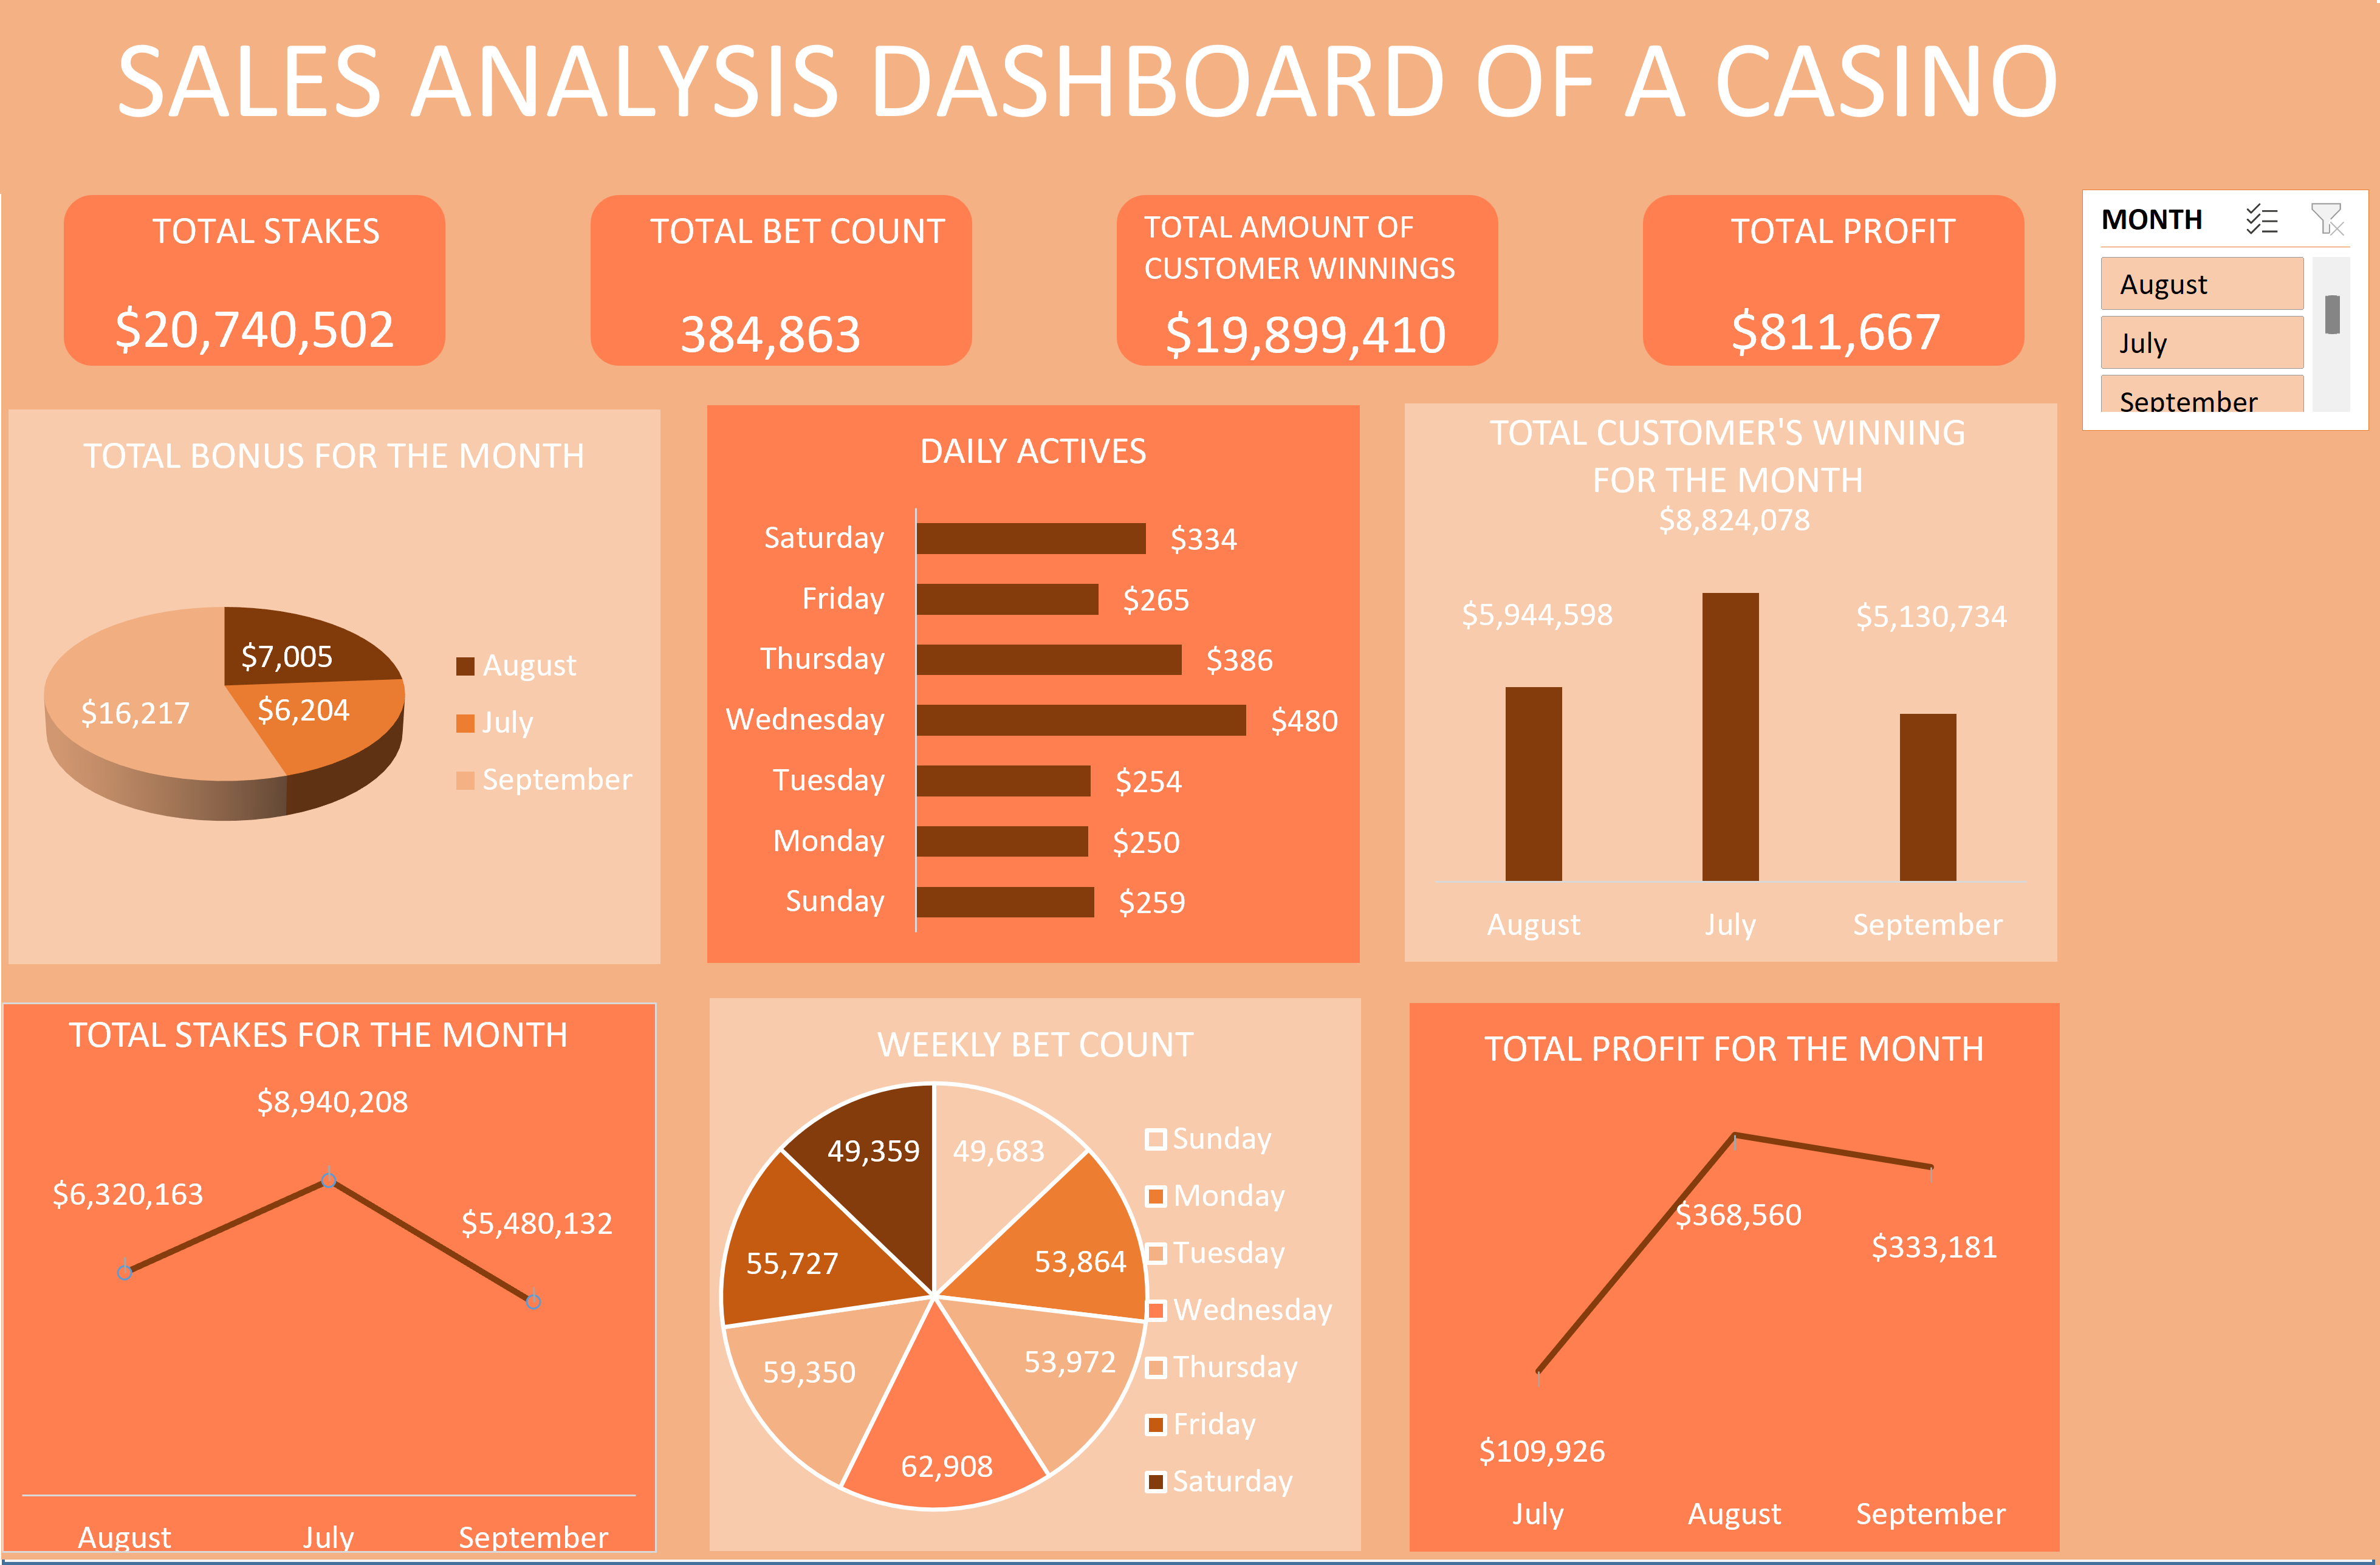
Turning numbers into strategy one spreadsheet at a time.
This Excel based dashboard dissects over $20 million in casino transactions to uncover key trends in customer behavior, profit margins, and betting patterns.
I designed it to solve a clear business problem: lack of visibility into when the casino truly performs. From identifying high engagement days to spotting profit draining months, the dashboard empowers data driven decisions around marketing, payouts, and promotions.
It showcases my ability to clean, analyze, and visualize data transforming raw figures into business ready insights that drive impact.
Click the dashboard to explore how data turns risk into reward.
Contact